It all started 3 years ago when, having gotten up ever earlier to get more miles in before work on a Thursday morning, Jo and wondered what it would take to get 100 miles in. Post wednesday night swimming we were drinking hot chocolate and it must have been around 10:30pm. We concluded it would involved just heading out around midnight and riding through till the morning. So we put our cycle kit on and headed out the door at midnight. We cycled 2.8 mile laps in the dark, headed to Brick Lane for a bagel and coffee and were pretty anti social when the others arrived at 6ish. At the time I can’t have thought much of it as I don’t appear to have mentioned it here.
We made a bonkers repeat that winter on the shortest day of the year before Gabriel and I repeated it in 2008. This was the scene of my biggest ever detonation. Last year we went back to do it properly and we hammered out a pretty decent time. This year we were planning on nailing it. Full aero setup and a 2:30am start time which not only gave us a little extra sleep but committed us to a fast time. We were hoping for sub 4:30.
The graph above shows the lap splits together with my average heart rate and power for each lap. On the second lap my right elbow pad sheers off which requires a stop and hunt in the dark for it. Now I’m not able to really hold the aero position. I try alsorts but I can only stay aero for short periods which I use for when I’m on the front. When on Gabriels wheels it’s definitely easier to stay aero but it’s too uncomfortable.
After 5 laps riding side by side to warm up we get organised and down to it by allternating laps. We couldn’t see our computers for the first 90 minutes so do it on feel. In hindsight I’m chuffed to bits with how evenly we shared the work and paced the ride. It gave some very interesting data from the powertap.

Here are power and heart rate data for a pretty typical lap. The top two graphs are me on the front the second two Gabriel on the front.
If you look carefully there’s an initial surge of power as we accelerate out of the right angle turn onto the main road at the start of each lap. I feel we over did the effort there every-time. When on the wheel you can see my fluctuating power as I ease off then speed up to maintain on the wheel. My heart rate steadily declines throughout the lap. The big drop in power at the end of Gabriels laps i the downhill where when on the wheel you get close to freewheeling.
So … we ended up completing 36 laps, 100.47 miles in 4:19 with an average power of 269 watts. Very pleased with it though I’ve been resting today in preparation for riding to Taunton tomorrow.
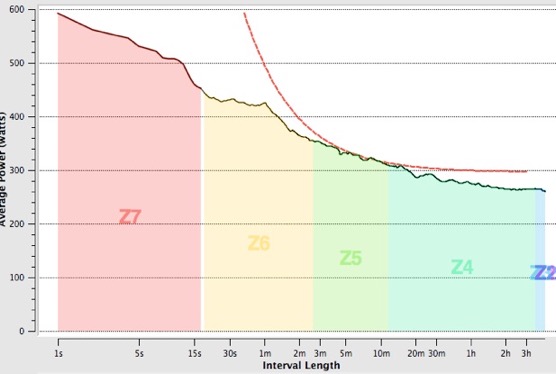
Got some solid power data so I’ll end with my first Critical Power graph.