
 Slowly finalising my macro plan for next year. As part of this I’m going to an entry analysing each aspect. This entry is the easiest one – swimming. Getting ready for something like the above – the race start at Panama City Beach for the 2006 Ironman Florida.
This is definitely the easiest aspect of my training to plan. I know precisely what I need to do to improve. Since my background is in swimming I’m not chasing PBs. At the moment I’m way slower than when I was a teenager and at University. So I know my technique is up to going a fair bit faster than I am currently. My swim speed boils down to time put in and effort put in during the sessions. If I increase my volume for a week I see improvements almost immediately. Last summer as I came back to training after Germany I did my biggest weeks swimming since I’ve done triathlon – over 33km all just steady sessions in the pool near my mums -no fancy smansy sessions just between 1.5 and 2 hrs each morning for 5 mornings on the trot. Each time swimming consistently slowly increasing the pace. Did me the world of good.

This graph gives a comparison of how many weeks exceed a certain number of KMs. It covers 2004 – 2008 plus the 2009 plan. My swimming was going well back in 2005 – I can remember consistently doing 200s in the low 2:30s. It dropped back over the next two years and then this year I’ve targeted getting some consistency in my swimming and getting the speed back. It’s worked and I’ve swum excellently all year. I’ve continued to improve. This Friday morning I did 8 x 400m on 5:30 the first four with hand paddles and I hit all of them between 5:15 – 5:20. It brought back to me why I swam so much when I was a kid. I could easily throw myself back into it and see how fast I could get. The graph above shows how in 2008 I had more weeks where I didn’t even manage 5km but when I did swim the distance tended to be greater. This reflects taking rest weeks during the year but when I’m training hitting all the club sessions more consistently. The plan shows trying to limit the low level weeks more but not being too ambitious about big weeks.
 The graph left confirms this. Red is 2009 plan, blue is 2008 actual and green is 2007 actual. It shows the WTD swim KMs.
My hope definitely is to get some big weeks in but I won’t plan them in. Much better for morale to exceed the plan than to fail to meet it.
Part of the new diary is to give “best ever” stats. In particular best ever day and week distances. For a while part of me was thinking I would aim to beat every best ever next year but when I created it it rather surprised me. Again, I’d forgotten some of what I’ve done in the past. For swimming for instance my best ever week is 33.4km which was this year (as mentioned above) – I’m hoping to beat this. My best ever day is 16.4km !!! This was in 2007 and seeing the figure brings the day back to me. I’d decided I wanted to see if I could swim 10km straight. I headed to the gym in the morning just as the pre work swimmers were finishing and set off. Something like two hours and forty five minutes later I’d managed it. As I left the lady on reception was clearly rather stunned … she’d seen on the CCTV that I’d been plodding up and down all morning. She was even more surprised when i turned up again after lunch. I’d found some sort of grove and just fancied another 6.4km in the afternoon. Can’t imagine feeling like that again.
Anyway… I decided to plot a graph of daily KM for swimming for that year and compare to this year. Another surprise:
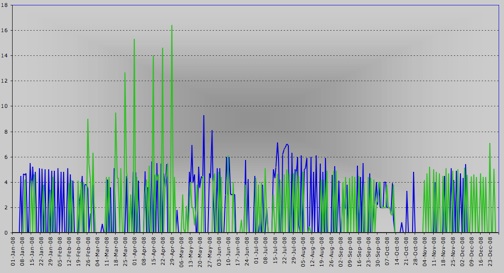
Green is 2007. That 16.4km doesn’t exactly dwarf all other weeks. Back in that period I was trying out doing loads of additional aerobic work in the pool. The idea being I could get some great benefits since I’d increase my aerobic capacity without trashing my legs thus allowing to maintain running and cycling volume. I still believe in this – there are limits to how much cycling and running you can do as your legs need to recover. If / when you reach this you can add swim volume if you want to still work your aerobic system. Is this what I did during that period ? Here is the above graph with week to date hours added:
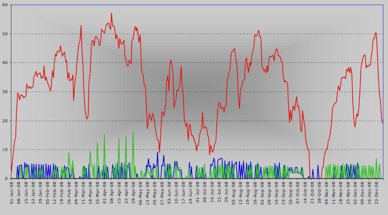 During the time I was doing those big swims my weekly hours were over 45 hours. It was certainly adding aerobic work to an already high load.
So… looking at the graph I had 5 days of over 12km swimming in April / May. What happened after that ? I was top 20 out of the swim at IM Lanzarote and followed that with probably my best ever Ironman performance finishing 17th overall !
The plan for next year is to try and continue what I’ve managed this year and where it’s convenient to do more. Since my location will change alot the swim facilities are difficult to predict. In Christchurch I’m hoping for more coached swimming than in London – it seems probably get 4 coached sessions a week plus open water once a week. In the run up to Lanzarote I’m hoping I will swim open water most days. The run up to Kona this year saw me swim everyday for 16 days … it worked a treat. With luck next year I’ll manage similar in the lead up to each of my Ironman races. The goal for Kona is to come out of the swim towards the front of the lead age group pack.
